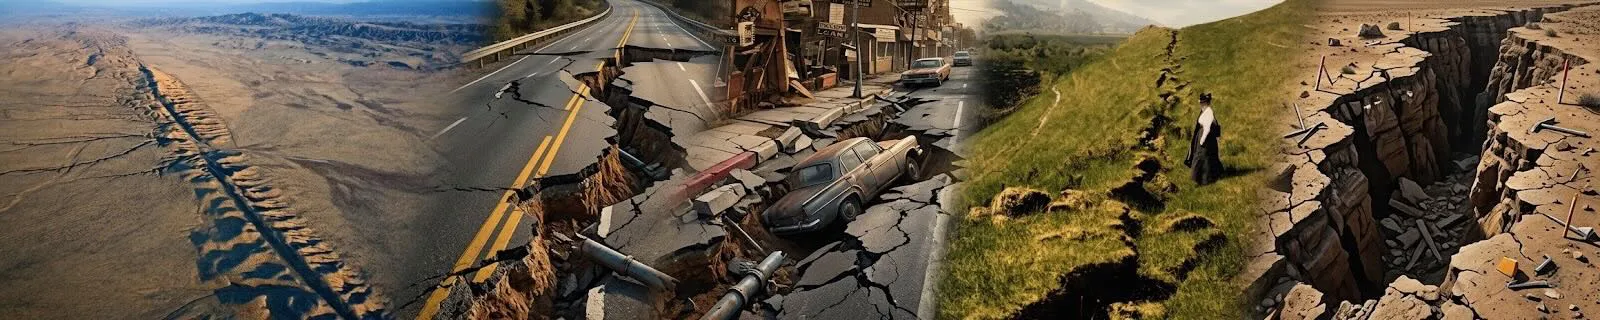
Santa Clara County, CA Fault Map
View earthquakes for the last 30 days
San Jose, Mountain View, Milpitas, Cupertino and Sunnyvale Faults
Santa Clara County, California, sits in a seismically active region, with several significant earthquake faults in its vicinity. Understanding these faults and their associated hazards is crucial for assessing earthquake risks in the area.
Faults Around San Jose
1. San Andreas Fault Zone
This is one of the most well-known faults in California, extending over 800 miles from the Salton Sea to Cape Mendocino. It is a transform fault, characterized by horizontal sliding between the Pacific and North American tectonic plates. The San Andreas Fault is known for generating significant earthquakes, and while the closest segment to San Jose is some distance away, its influence is felt regionally.
2. Hayward Fault Zone
This fault runs through the eastern part of the San Francisco Bay Area, including close to San Jose. It is a strike-slip fault, where the two sides of the fault slide past each other horizontally. The Hayward Fault is considered very active and is known for its potential to produce large earthquakes, similar to the 1868 Hayward earthquake.
3. Calaveras Fault Zone
This fault is another strike-slip fault running through the eastern Bay Area, including near San Jose. It is active and capable of producing significant earthquakes. The Calaveras Fault is known for its seismic activity, contributing to the overall earthquake risk in the San Jose region.
4. San Gregorio Fault Zone
Located further west, this transform fault extends along the San Gregorio Peninsula. While it is not directly beneath San Jose, its seismic activity can influence the broader Bay Area.
5. Zayante-Vergeles Fault Zone
This fault is a reverse fault, where the hanging wall moves up relative to the footwall. It is located to the south of San Jose and has the potential to generate earthquakes, though it is less active compared to the San Andreas and Hayward faults.
6. Silver Creek Fault Zone
This is another reverse fault located southeast of San Jose. Its activity can contribute to the seismic hazard in the region, though it is not as prominent as some of the other faults.
7. Sargent Fault Zone
A reverse fault situated to the south of San Jose, the Sargent Fault contributes to the region’s overall seismic hazard, though it is less active compared to the Hayward and San Andreas faults.
8. Mission Fault
Located near the eastern part of San Jose, this reverse fault is relatively less well-studied but adds to the region's seismic complexity.
9. Stanford Fault
This is a reverse fault near Stanford University, which can contribute to local seismic risks.
10. Berrocal Fault Zone
Another reverse fault located to the south of San Jose, contributing to the overall seismic risk in the region.
11. Monte Vista-Shannon Fault Zone
This reverse fault is situated near San Jose and is part of the broader network of faults affecting the region.
12. Coyote Creek Fault Zone
This strike-slip fault runs through the eastern part of the Bay Area, including areas close to San Jose. Its seismic activity adds to the overall risk profile for the city.
Fault Activity and Seismic Hazards
Among these faults, the San Andreas Fault Zone, Hayward Fault Zone, and Calaveras Fault Zone are the most active and pose the greatest seismic risk to San Jose. The Hayward Fault, in particular, is known for its potential to produce a large earthquake due to its history of significant seismic activity.
In the event of a major earthquake, San Jose would face several hazards:
- Liquefaction: Areas with saturated, loose sediments could experience liquefaction, where the ground behaves like a liquid during shaking. This can lead to significant damage to buildings and infrastructure.
- Landslides: The hilly terrain around San Jose, especially in the southern and eastern parts, is susceptible to landslides triggered by seismic shaking.
- Tsunami: While San Jose itself is not directly on the coast, a large earthquake elsewhere could potentially generate a tsunami that affects the Bay Area.
- Building and Freeway Collapse: The city's infrastructure, including older buildings and freeways, could be at risk of collapse or severe damage, especially if they are not up to modern seismic codes.
- Fires: Earthquake-induced fires could result from damaged gas lines and electrical systems.
Areas Most at Risk
In a large earthquake, areas closest to active faults such as those near the eastern and southern parts of San Jose would experience the worst shaking. The regions near the Hayward Fault and Calaveras Fault, including parts of downtown San Jose and surrounding neighborhoods, are particularly vulnerable.
Historical Earthquakes
Over the past 200 years, the San Jose area has experienced several significant earthquakes:
- 1868 Hayward Earthquake: This magnitude 6.8 event was centered near the Hayward Fault and had a significant impact on the Bay Area, including San Jose.
- 1906 San Francisco Earthquake: While the epicenter was in San Francisco, this magnitude 7.9 quake affected the entire Bay Area, including San Jose.
Understanding these faults and the associated hazards helps in preparing for and mitigating the impacts of potential future earthquakes in San Jose.
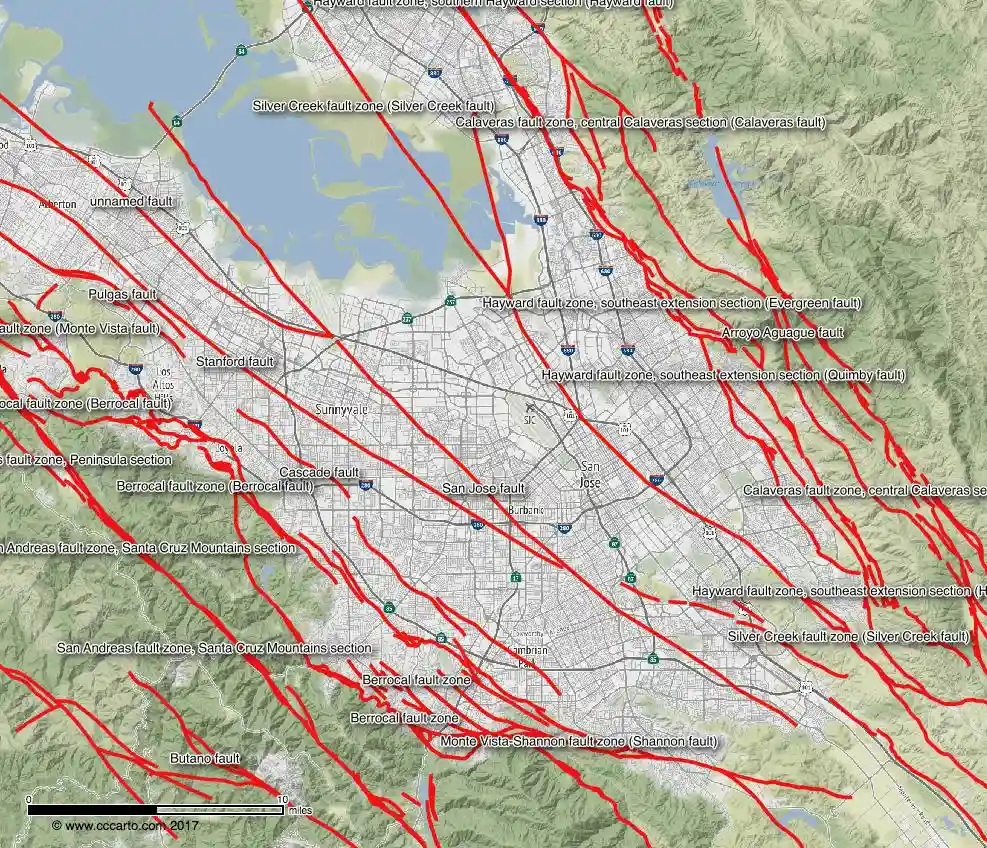
San Jose Fault Map
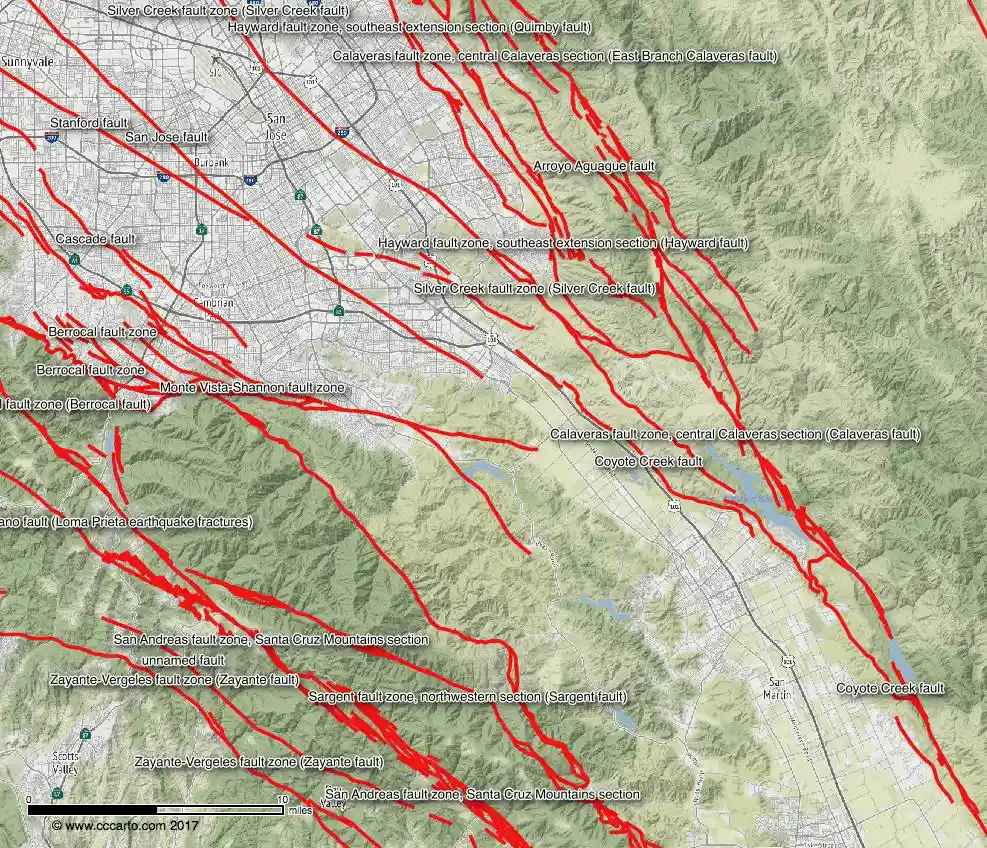
South San Jose Fault Map
Fault Attributes Key
NAME is an 80-character field for the name of the fault (including section name,
i.e., Denali fault, Holitna section). Fault and section are lower case.
CODE is a three-integer field.that defines certainty or reliability of field mapping
(integer one), time of most recent movement (integer two), and amount or rate of slip (integer three).
CODE is composite of the single integer fields ACODE, SLIPCODE, and FCODE
and determines the line type (fault trace) to be plotted.
NUM is a six-character unique USGS identifier that defines a fault or section id. Simple fault
ids are only numeric; section ids are alpha numeric.
AGE is the upper bounding time of the most recent surface-deforming earthquake. The allowable
choices are provided in a pull-down menu.
ACODE is the second integer in CODE and defines the upper bounding time of the most recent
surface-deforming earthquake.
Permissible values are between 1 and 6: 1=historic «150 years; red =cmyk 1096680);
2= post glacial (15,000 years; orange = cmyk 1 38 1000);
3 = late Quaternary «130,000 years; green> cmyk 1002500);
4 =middle and late Quaternary «750,000 years: blue > cmyk 1004440);
5 =Quaternary «1,600,000 years; black 5);
6 = Class B (black halftone)
In the text documentation, Quaternary faults (integer two, 1-5) are Class A structures. Questionable or
suspected structures are Class B (integer two, 6).
SLIPRATE is the assigned slip rate category.
SLIPCODE is the third integer in CODE and defines the assigned slip rate category. Permissible
values are between 1 and 4 and determines line width:
1=>5 mm/year (extra wide; .048):
2 =1-5 mm/year (wide; .0325):
3 =0.2-1 mm/year (medium; .025);
4 =<.2 mm/year (thin; .015)
SLIPSENSE is normal, reverse, strike slip, thrust
DIPDIRECTION is one of the eight quadrant dip directions for the entire fault or section, not the
individual arc. C = center E =east N_ =north NE =northeast NW =northwest S =south SE =southeast SW =
southwest W_ =west
SLIPDIRECT (we are not using that field anymore and can be left empty) FCODE is the first integer
in CODE and defines how well the fault is located and expressed in the landscape. Permissible values are
between 1 and 3:
1 = fault landforms are more continuous than discontinuous and mapping is accurate at
given MAPPEDSCALE (solid);
2 = fault landforms are more discontinuous than continuous and mapping is accurate at
given MAPPEDSCALE (dashed);
3 = location of fault is inferred (dotted)
FTYPE is one of three allowable choices provided in a pull-down menu: Well constrained (FCODE 1),
Moderately constrained (FCODE 2), and Inferred (FCODE 3)
MAPPEDSCALE is one of four allowable choices provided in a pull-down menu.
Mapped scale will control visualization of the fault at various scales.
1:24,000, fault should be more continuous than discontinuous and mapping is accurate at <10,000 scale.
1:50,000, fault should be more continuous than discontinuous and mapping is accurate at <25,000 scale.
1:100,000, fault could be more discontinuous than continuous and mapping is accurate at <50,000 scale.
1:250,000, fault location may be inferred or is poorly constrained.
Data source: USGS
CCCarto is not responsible for data errors or omissions, use as reference only.
copyright cccarto.com 2026