Earthquake Fault Maps
🗺 Click to explore interactive map
Mammoth Lakes Earthquake Faults Map
View earthquakes for the last 30 days
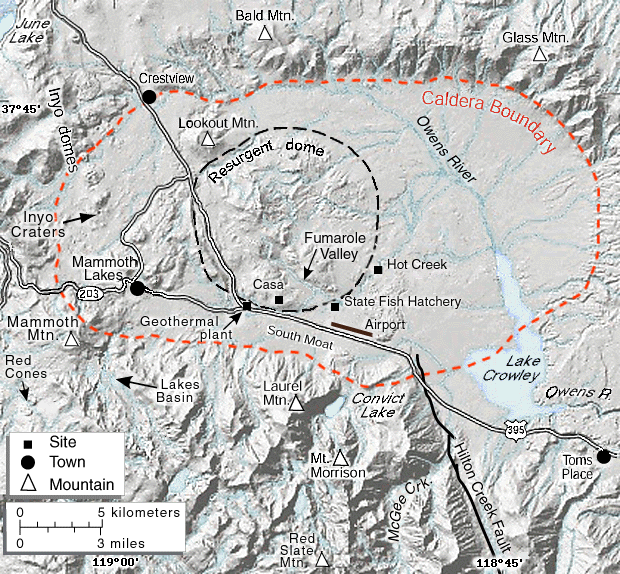
Long Valley and Mammoth Lakes Seismic Area
The Long Valley Caldera and the surrounding area, including Mammoth Mountain and Mammoth Lakes, are geologically active and have a complex history of volcanic and seismic activity. Here's a detailed breakdown:
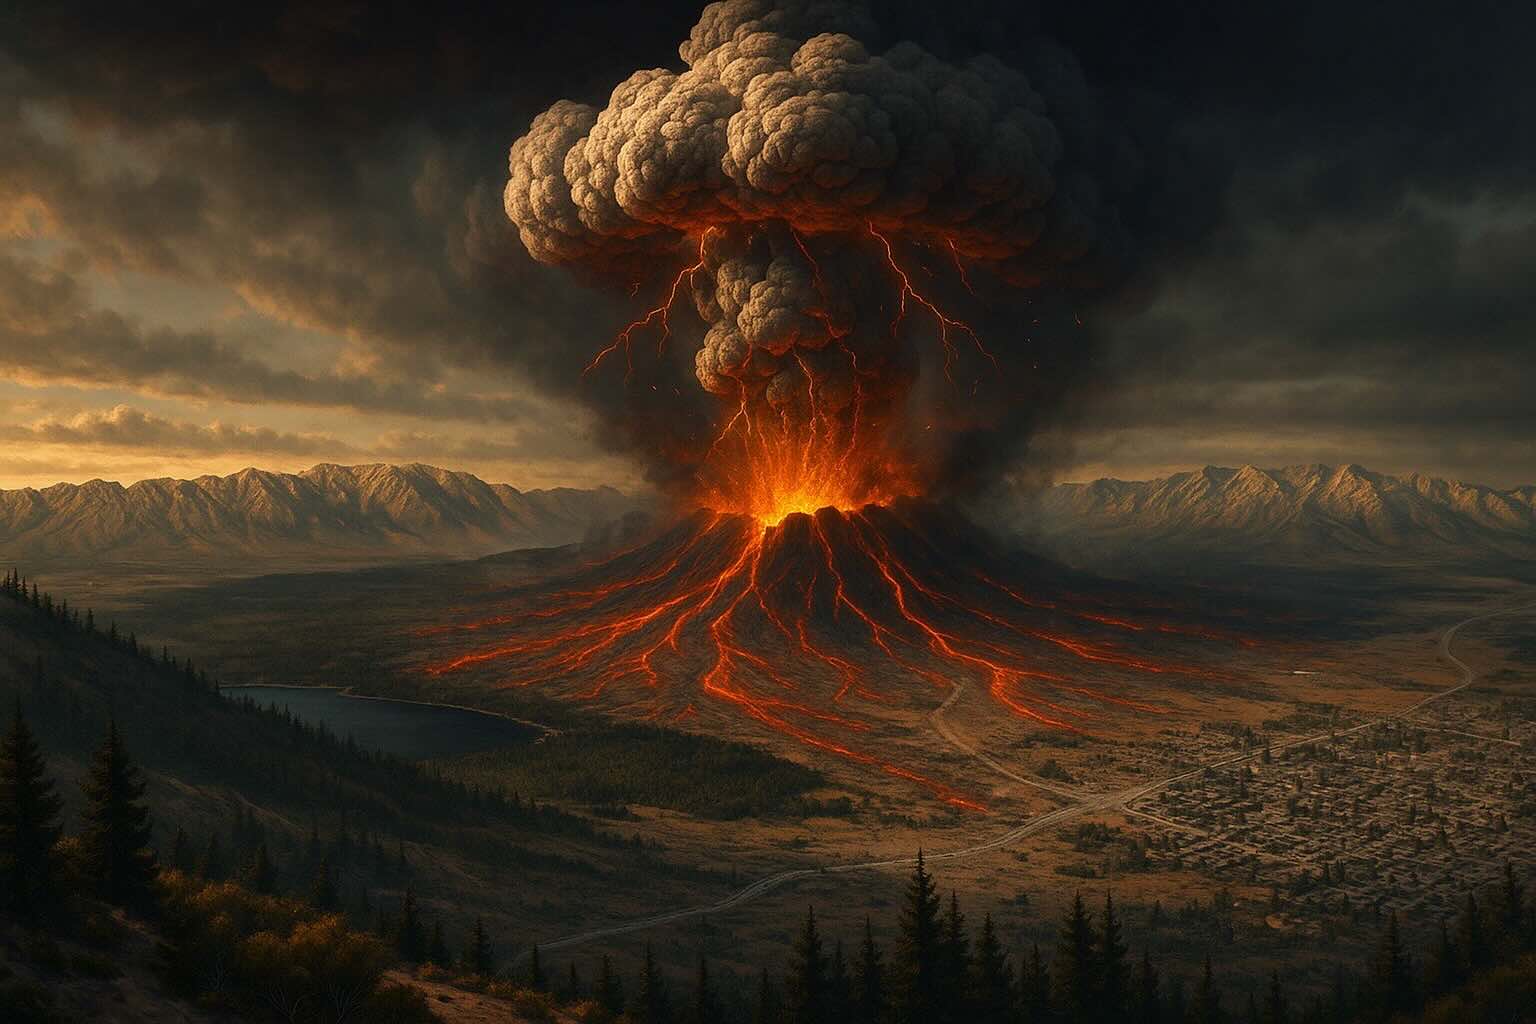
What Mammoth Lakes Area could look like in the distant future if the Caldera Erupted.
Major Fault Lines in the Mammoth Mountain & Long Valley Caldera Area
- Hilton Creek Fault: Runs along the southern edge of the caldera. It has shown significant seismic activity and is one of the most active faults in the region.
- Round Valley Fault: Located southwest of the caldera, it is known for producing large earthquakes.
- Hartley Springs Fault: Located on the northwest side of the caldera, this fault has had significant recent movement.
- Mammoth Mountain Fault System: A complex system of faults associated with the volcanic activity of Mammoth Mountain.
Activity of the Long Valley Caldera
- Ongoing Activity: The Long Valley Caldera remains an active volcanic system. It experiences frequent small earthquakes and ground deformation due to magma movement beneath the surface. The most recent significant activity occurred in the early 1980s when there was an increase in earthquake swarms and ground uplift, raising concerns about a possible eruption.
Significant Earthquakes and Volcanic Eruptions in the Last 500,000 Years
- Bishop Tuff Eruption (~760,000 years ago): This was one of the largest volcanic events in the area, which formed the Long Valley Caldera. The eruption ejected an estimated 600 cubic kilometers (144 cubic miles) of ash and pumice.
- Mono-Inyo Craters Volcanic Chain: Over the past 40,000 years, there have been several eruptions along this chain, with the most recent occurring about 600 years ago.
Landmarks Created by Volcanic and Earthquake Activity
- Mammoth Mountain: A large volcanic dome that is part of the Long Valley Caldera’s volcanic system.
- Mammoth Lakes: Formed as a result of glacial and volcanic activity. The region’s numerous lakes were shaped by the interplay of these forces.
- Hot Creek: A geothermal area created by volcanic activity, where hot springs and fumaroles are visible.
- Devils Postpile: A geological formation of columnar basalt, formed by a lava flow that cooled and cracked into hexagonal columns.
Hazard to Local Homes, Businesses, and Life
- The Long Valley Caldera is considered a high-risk area due to the potential for volcanic eruptions and large earthquakes. A major eruption could produce pyroclastic flows, ashfall, and significant ground deformation, all of which could pose severe threats to life and property.
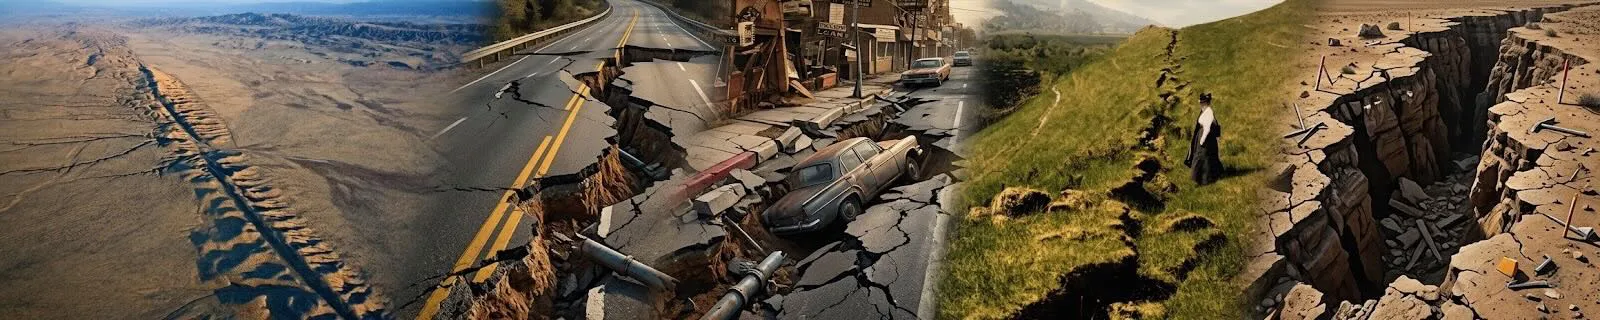
- Seismic activity in the area can also cause structural damage to buildings and infrastructure, leading to potential casualties and economic losses.
Ash Ejection and Coverage from the Bishop Tuff Eruption
- Ash Volume: The Bishop Tuff eruption ejected approximately 600 cubic kilometers of material.
- Ash Coverage: The ash spread across much of the western United States, with deposits found as far east as Nebraska and Kansas. The ashfall was several feet thick near the caldera and gradually thinned out with distance.
Safety of Living in Mammoth Lakes in the Next Fifty Years
- Volcanic Risk: While the probability of a major eruption is relatively low, the area is closely monitored by the US Geological Survey (USGS) for signs of volcanic unrest.
- Seismic Risk: The area is seismically active, and residents should be prepared for the possibility of earthquakes.
- Mitigation: Proper building codes, disaster preparedness plans, and staying informed through USGS alerts can help mitigate risks.
Overall, living in Mammoth Lakes comes with geological risks, but with proper precautions, these risks can be managed effectively.
Mammoth Lakes Area Faults:
Long Valley Caldera Fault Map

Owens Gorge Fault Map

Bishop California Fault Map

Mono Lake Fault Map

Long Valley Caldera Seismic Unrest
In the early eighties, a strong earthquake swarm of 72 quakes that included four Richter magnitude 6 earthquakes hit and awoke the southern margin of Long Valley Caldera, associated with a ten-inch dome-formed upward movement of the huge caldera basin. These earthquakes marked the onset of the latest era of caldera seismic unrest that continues to this day. This ongoing movement includes recurring area earthquake swarms and continued dome bulge uplift of the central area of the caldera (name: Resurgent Dome), paired with changes in thermal springs activity and temperatures, and gas emissions.
After the large May 25, 1980 earthquake, another area road was created as an evacuation route. It was first named the "Mammoth Escape Route" but was changed to the "Mammoth Scenic Loop" after Mammoth area businesses and property owners complained. This evacuation route was critical to the safety planning, as the potential for volcanic activity remains a concern.
Volcanic and Seismic Activity
The recurring past earthquake swarms and episodes of ground uplift (particularly the uplift centered on Long Valley Caldera’s Resurgent Dome) that dominated the geologic unrest in Long Valley Caldera through the early 1980s and 1990s emphasize that this large silicic magmatic system is still active and capable of producing volcanic eruptions.
From 1980 to 1984, the resurgent dome experienced an uplift of about 10 inches (25 cm), and even today, it continues to show smaller episodes of activity. The area sees thousands of earthquakes annually, most of which are small, though occasional earthquake swarms draw attention to the system's potential activity.
Color Code Warning System
The four-level color code warning conditions were developed in collaboration with Mono County, the Town of Mammoth Lakes, the California Earthquake Prediction Evaluation Council (CEPEC), and the California Division of Mines and Geology (CDMG). It was formally adopted in June 1997 in an effort to simplify and clarify the five-level alphabetic E through A status system initially adopted in 1991.
The levels of the color code system are as follows:
- Green: Background seismicity. No immediate threat of volcanic activity.
- Yellow: Signs of increased seismicity and ground deformation. Increased monitoring in place.
- Orange: Increased likelihood of volcanic unrest. Precautionary measures are taken.
- Red: Imminent or ongoing volcanic activity. Evacuation routes prepared and emergency services on alert.
Recent Developments
Since the adoption of the color code system, Long Valley Caldera has remained at Yellow for much of the last decade, with periodic shifts to Orange during seismic swarms. Ongoing research and advanced monitoring technologies have been implemented to better track ground deformation, gas emissions, and seismicity in the region. These include GPS stations and continuous gas monitoring devices to provide real-time data to scientists and local authorities.
The U.S. Geological Survey (USGS) continues to monitor the region and releases periodic updates about the status of Long Valley Caldera, ensuring the public is informed of any significant changes in activity.
Color Code Warnings
CONDITION GREEN - No Immediate Risk
Background typically includes several Magnitude 2 earthquakes per day with 10-20 smaller events and CO2 emissions at Mammoth Mountain < 500 t/day.
CONDITION YELLOW - WATCH
A swarm and 1 Magnitude 5, 5 Magnitude 4, or 30 Magnitude 3 events per day OR average strain rates of 1 ppm per day or displacements of 5 mm per day on 3 or more instruments sustained for 48 hours.
CONDITION ORANGE - WARNING
Accelerating Intense Unrest. ERUPTION LIKELY within hours or days.
CONDITION RED - ERUPTION IN PROGRESS
Eruptive activity characterized by any of the following:
Small-Large explosive blasts either phreatic or magmatic
Effusive lava fountains feeding fluid lava flows
Dome growth
Eruption column, if present, may reach 1 km above vent elevation
Hazardous zone(s) subject to ballistic ejecta or small pyroclastic flows generally limited to 1 to 2 km from eruption vent
Minor downwind ash fall possible
Long Valley Caldera Ring Fault Map Resources
USGS Current Earthquakes Map
Long Valley Caldera
Fault Attributes Key
NAME is an 80-character field for the name of the fault (including section name, i.e., Denali fault, Holitna section). Fault and section are lower case.
CODE is a three-integer field that defines certainty or reliability of field mapping (integer one), time of most recent movement (integer two), and amount or rate of slip (integer three). CODE is a composite of the single integer fields ACODE, SLIPCODE, and FCODE and determines the line type (fault trace) to be plotted.
NUM is a six-character unique USGS identifier that defines a fault or section ID. Simple fault IDs are only numeric; section IDs are alphanumeric.
AGE is the upper bounding time of the most recent surface-deforming earthquake. The allowable choices are provided in a pull-down menu.
ACODE is the second integer in CODE and defines the upper bounding time of the most recent surface-deforming earthquake. Permissible values are between 1 and 6: 1 = historic «150 years; red = cmyk 1096680); 2 = post glacial (15,000 years; orange = cmyk 1 38 1000); 3 = late Quaternary «130,000 years; green> cmyk 1002500); 4 = middle and late Quaternary «750,000 years: blue > cmyk 1004440); 5 = Quaternary «1,600,000 years; black 5); 6 = Class B (black halftone). In the text documentation, Quaternary faults (integer two, 1-5) are Class A structures. Questionable or suspected structures are Class B (integer two, 6).
SLIPRATE is the assigned slip rate category.
SLIPCODE is the third integer in CODE and defines the assigned slip rate category. Permissible values are between 1 and 4 and determine line width: 1 = >5 mm/year (extra wide; .048); 2 = 1-5 mm/year (wide; .0325); 3 = 0.2-1 mm/year (medium; .025); 4 = <.2 mm/year (thin; .015).
SLIPSENSE is normal, reverse, strike slip, thrust.
DIPDIRECTION is one of the eight quadrant dip directions for the entire fault or section, not the individual arc. C = center, E = east, N = north, NE = northeast, NW = northwest, S = south, SE = southeast, SW = southwest, W = west.
SLIPDIRECT (we are not using that field anymore and can be left empty)
FCODE is the first integer in CODE and defines how well the fault is located and expressed in the landscape. Permissible values are between 1 and 3: 1 = fault landforms are more continuous than discontinuous and mapping is accurate at given MAPPEDSCALE (solid); 2 = fault landforms are more discontinuous than continuous and mapping is accurate at given MAPPEDSCALE (dashed); 3 = location of fault is inferred (dotted).
FTYPE is one of three allowable choices provided in a pull-down menu: Well constrained (FCODE 1), Moderately constrained (FCODE 2), and Inferred (FCODE 3).
MAPPEDSCALE is one of four allowable choices provided in a pull-down menu. Mapped scale will control visualization of the fault at various scales. 1:24,000, fault should be more continuous than discontinuous and mapping is accurate at <10,000 scale. 1:50,000, fault should be more continuous than discontinuous and mapping is accurate at <25,000 scale. 1:100,000, fault could be more discontinuous than continuous and mapping is accurate at <50,000 scale. 1:250,000, fault location may be inferred or is poorly constrained.
Click on the fault lines for more information. Note* The earthquake faults are color-coded by unique name and section, not type.
Click on the fault lines for more information.
Note* The earthquake faults are color coded by unique name and section not type.
Data source: USGS
CCCarto is not responsible for data errors or omissions, use as reference only.
copyright cccarto.com 2026