Alaska’s Glaciers in 2025 — status, hotspots, and what’s vanishing fastest
Alaska still has tens of thousands of glaciers, but most are shrinking or thinning. Roughly 27,000 were mapped in a statewide inventory (2011), with ~600–650 officially named; the oft-repeated “100,000” is a broad estimate, and the total ice area is trending down. Alaska has been one of the world’s largest regional contributors to sea-level rise from glaciers this century.
Bottom line: The steepest losses are in the coastal south and southeast — Kenai Fjords/Harding Icefield, Prince William Sound (e.g., Columbia), Glacier Bay–Juneau Icefield, and the Yakutat–St. Elias sector (e.g., Malaspina thinning). Interior/Alaska Range valley glaciers (e.g., Gulkana, Black Rapids) are smaller and retreating too, but maritime/lake-terminating glaciers are retreating fastest. One notable exception: Hubbard Glacier is still advancing.
Hotspots — where change is fastest
- Kenai Fjords & the Harding Icefield: Many outlet glaciers are retreating; lake-terminating outlets tend to recede the quickest. Exit Glacier is a visible example near Seward.
- Prince William Sound (Chugach): Columbia Glacier has retreated >20 km since the 1980s; large thickness loss and rapid calving-front change.
- Juneau Icefield & Glacier Bay (SE Panhandle): Ice loss accelerated after ~2005. Even formerly advancing Taku Glacier has begun retreating. In 2025, retreat at Alsek Glacier exposed a brand-new island in Glacier Bay country.
- Yakutat–St. Elias coast: Malaspina (Sít’ Tlein), the world’s largest piedmont glacier, is thinning >1 m/yr in places and is vulnerable along its low-elevation, lake-studded foreland.
- Alaska Range/interior valleys: Smaller valley glaciers like Gulkana and Black Rapids show persistent mass loss and area shrinkage.
Major glaciers (quick roles & trends)
Columbia (Prince William Sound)
Tidewater glacier with dramatic retreat and thinning since the 1980s; textbook case of rapid dynamic change.
Tidewater glacier with dramatic retreat and thinning since the 1980s; textbook case of rapid dynamic change.
Juneau Icefield
Plateau icefield losing mass faster since ~2010; many outlets receding; Taku has transitioned to retreat.
Plateau icefield losing mass faster since ~2010; many outlets receding; Taku has transitioned to retreat.
Malaspina (Sít’ Tlein)
Enormous piedmont lobe; widespread thinning and foreland lakes raise risk of more rapid future retreat.
Enormous piedmont lobe; widespread thinning and foreland lakes raise risk of more rapid future retreat.
Hubbard
A notable outlier: still advancing and has twice dammed Russell Fjord (1986, 2002); closely watched for future closures.
A notable outlier: still advancing and has twice dammed Russell Fjord (1986, 2002); closely watched for future closures.

Why some glaciers vanish faster
- Terminus in deep water: Tidewater/lake-terminating glaciers can retreat quickly due to undercutting, calving, and feedbacks where deeper water meets the ice front.
- Low, flat “plateau” icefields: When warming thins broad plateaus (e.g., Juneau Icefield), a very large area experiences melt at once, accelerating shrinkage.
- Maritime climate: Warmer, wetter coasts bring heavy melt seasons; interior glaciers also shrink, but generally lack the fast calving dynamics of deep-water fronts.
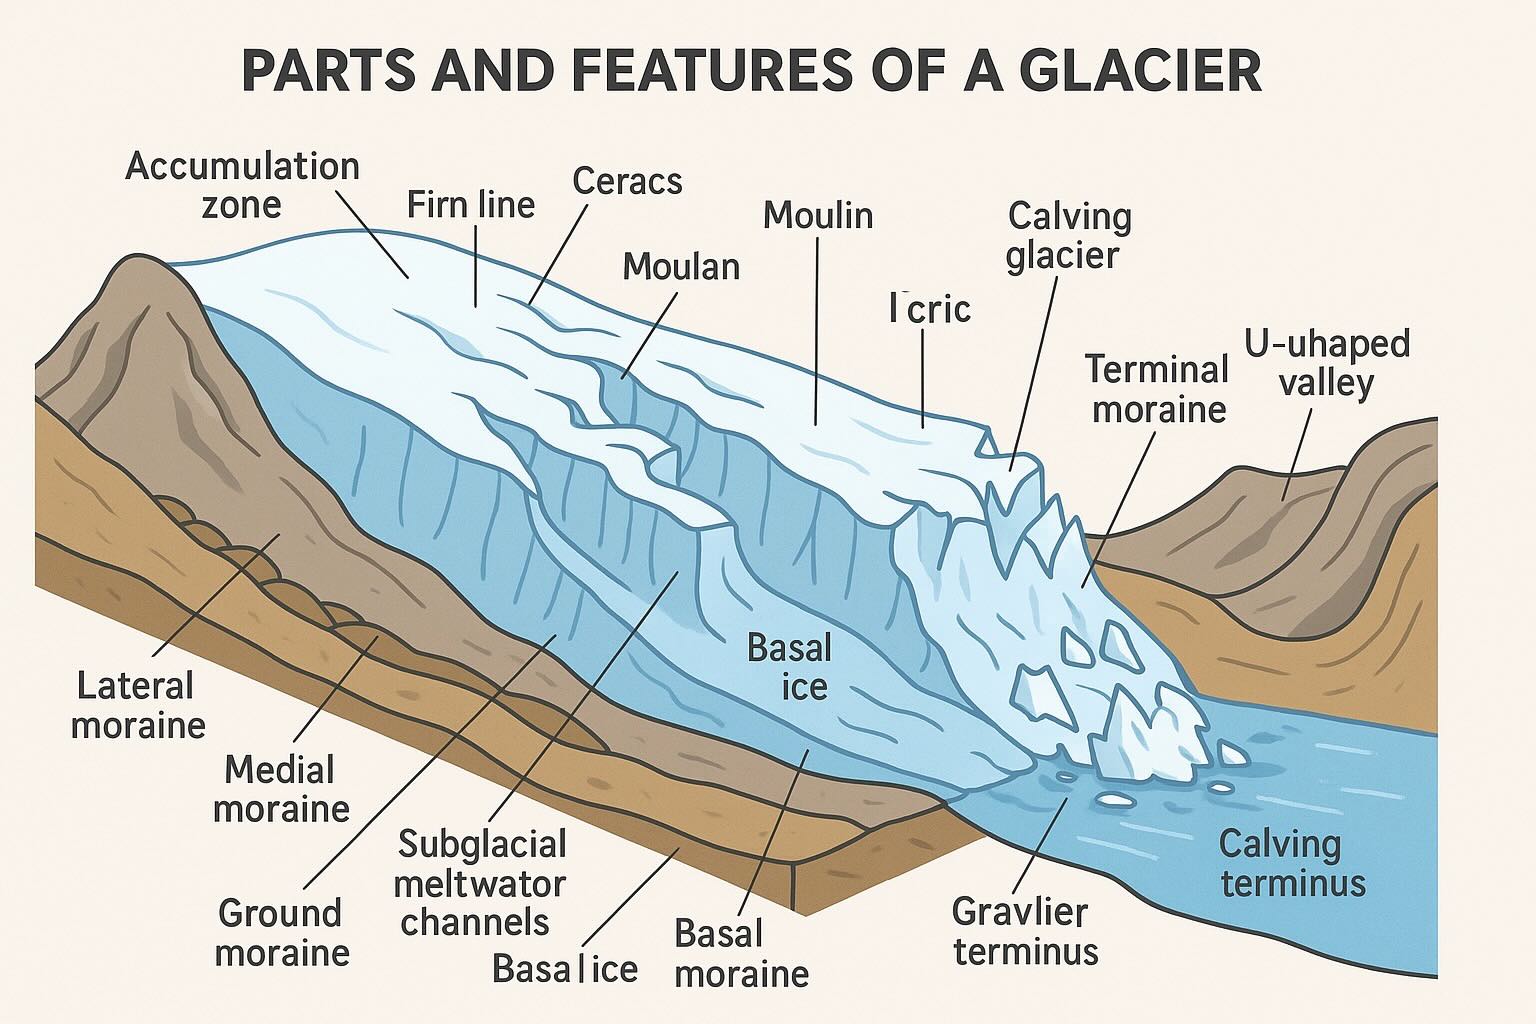
Types of Glaciers
Valley (e.g., Matanuska, Exit) · Tidewater (e.g., Columbia, Hubbard) · Cirque (small headwall niches) · Piedmont (e.g., Malaspina) · Icefields (e.g., Harding, Juneau). Continental ice sheets are not present in Alaska today.